The Trends That Defined Cyber Week 2025

Written by Daniel Caponetti, Data & Analytics Director; Kevin Metzger, Senior Digital Analyst; Ryan Hinrichs, Associate Analyst; Macee Rea, Digital Operations Manager; and Chase Ennis, Associate Director of Data Systems & Business Intelligence
Cyber Week remains one of the most revealing moments of the year for understanding how outdoor consumers discover, evaluate, and buy. This report brings forward qualitative insights and hard data to help brands and marketers understand where the market is heading and how to plan for a successful 2026.
Unless otherwise specified, the following results are from Cyber Week, defined as Tuesday (11/25) through Cyber Monday (12/1). Unless otherwise specified, all insights are derived by calculating the median value across every brand in our sample to control for volume disparities between brands.
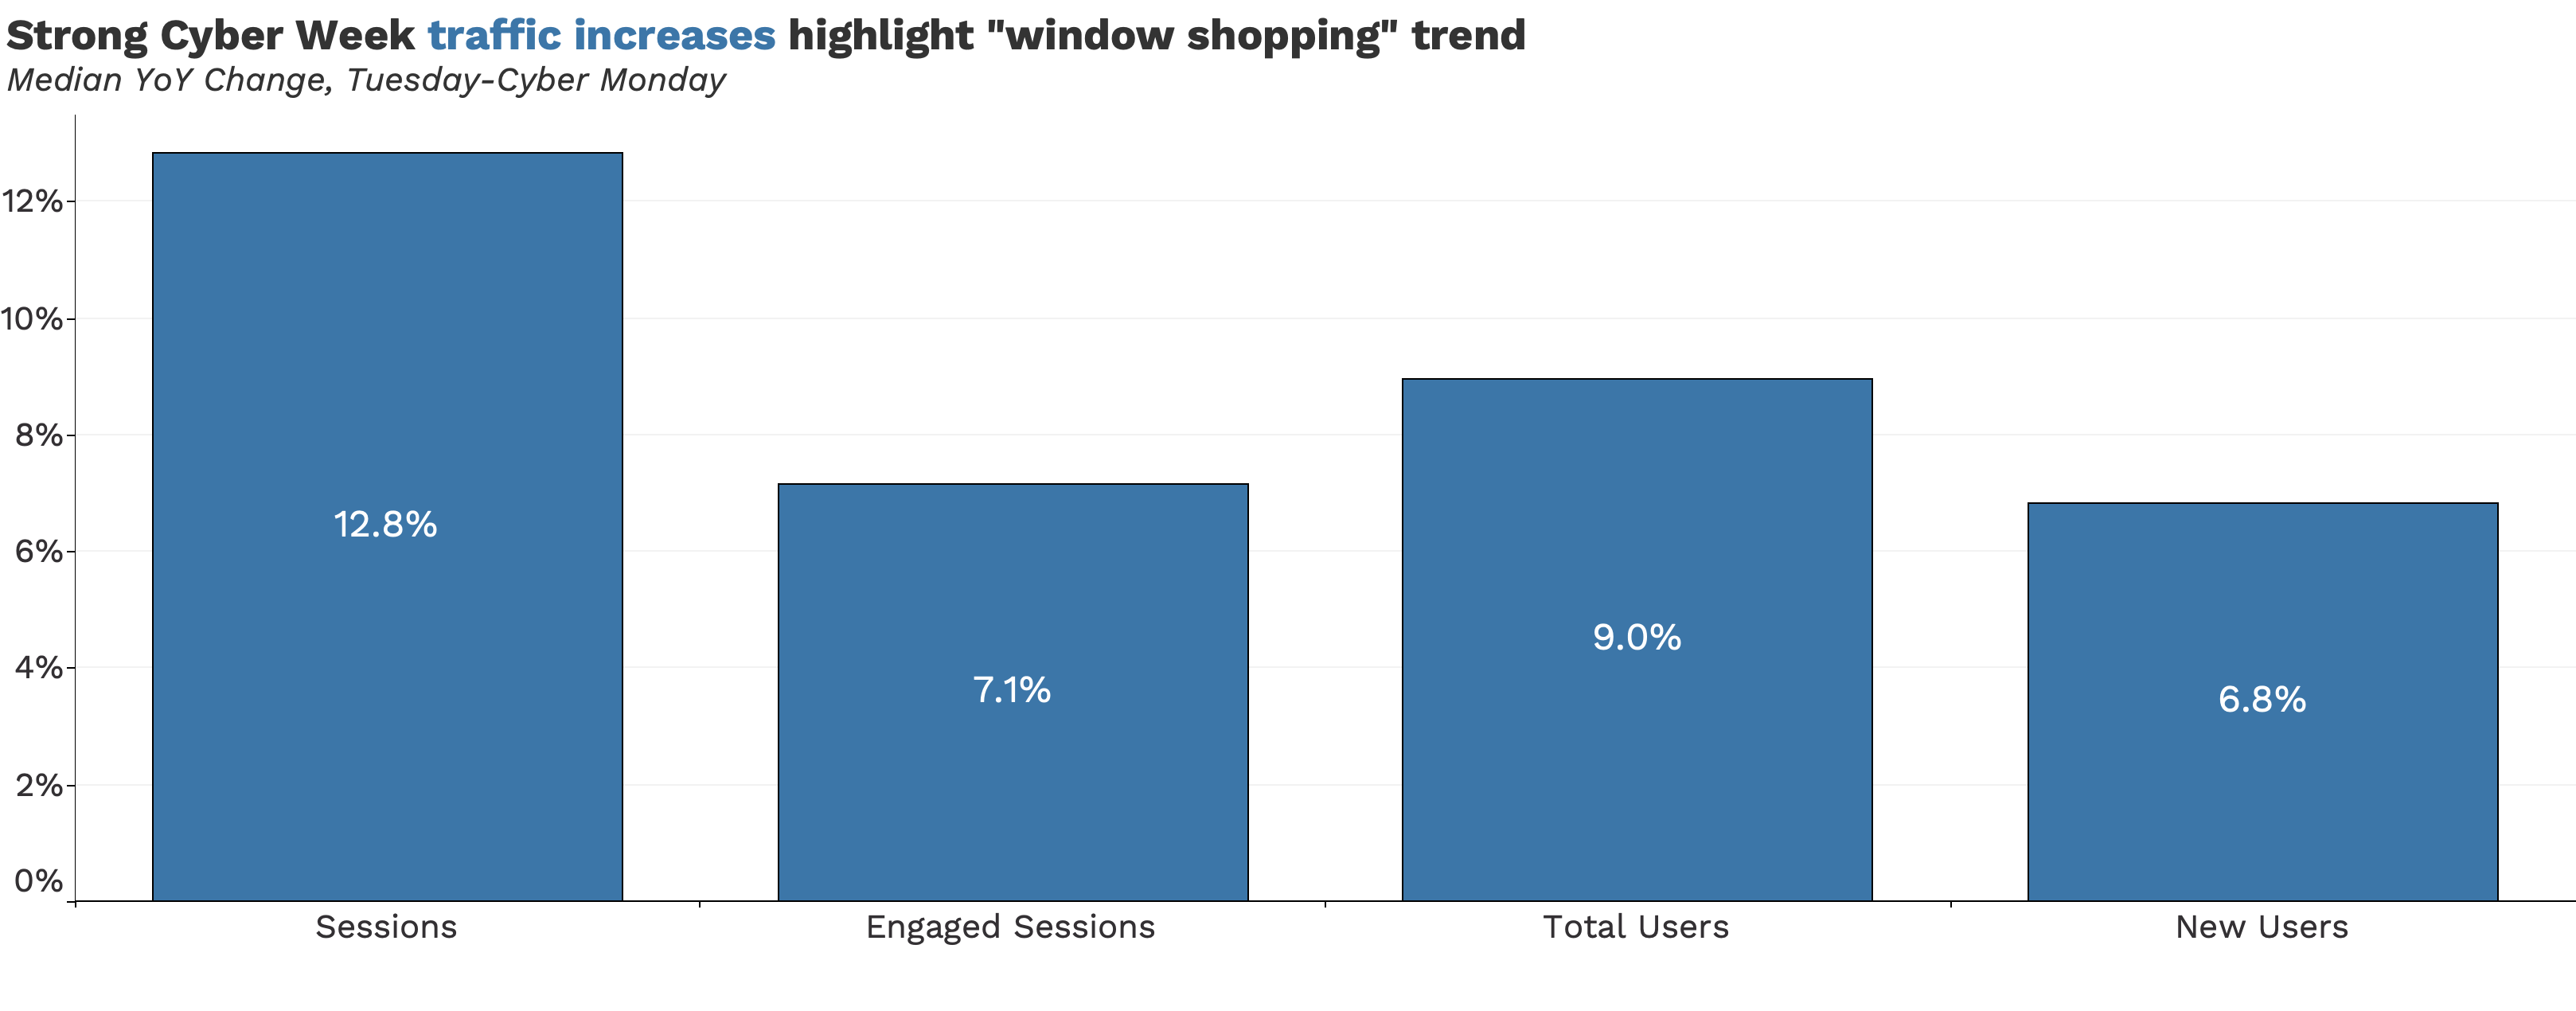
People did more online window shopping than last year.
Cyber Week delivered more visitors to e-commerce brand sites this year with median session growth of 13%, YoY. The increased traffic was engaged at similar levels to 2024, as the median engagement rate change was virtually flat (-1% on average).
With a median new user growth of 6.8% YoY, brands successfully reached new audiences. Still, median total user growth (9.0%) slightly outpaced new user growth, meaning much of the traffic boost during the sale period was from repeat site visitors.
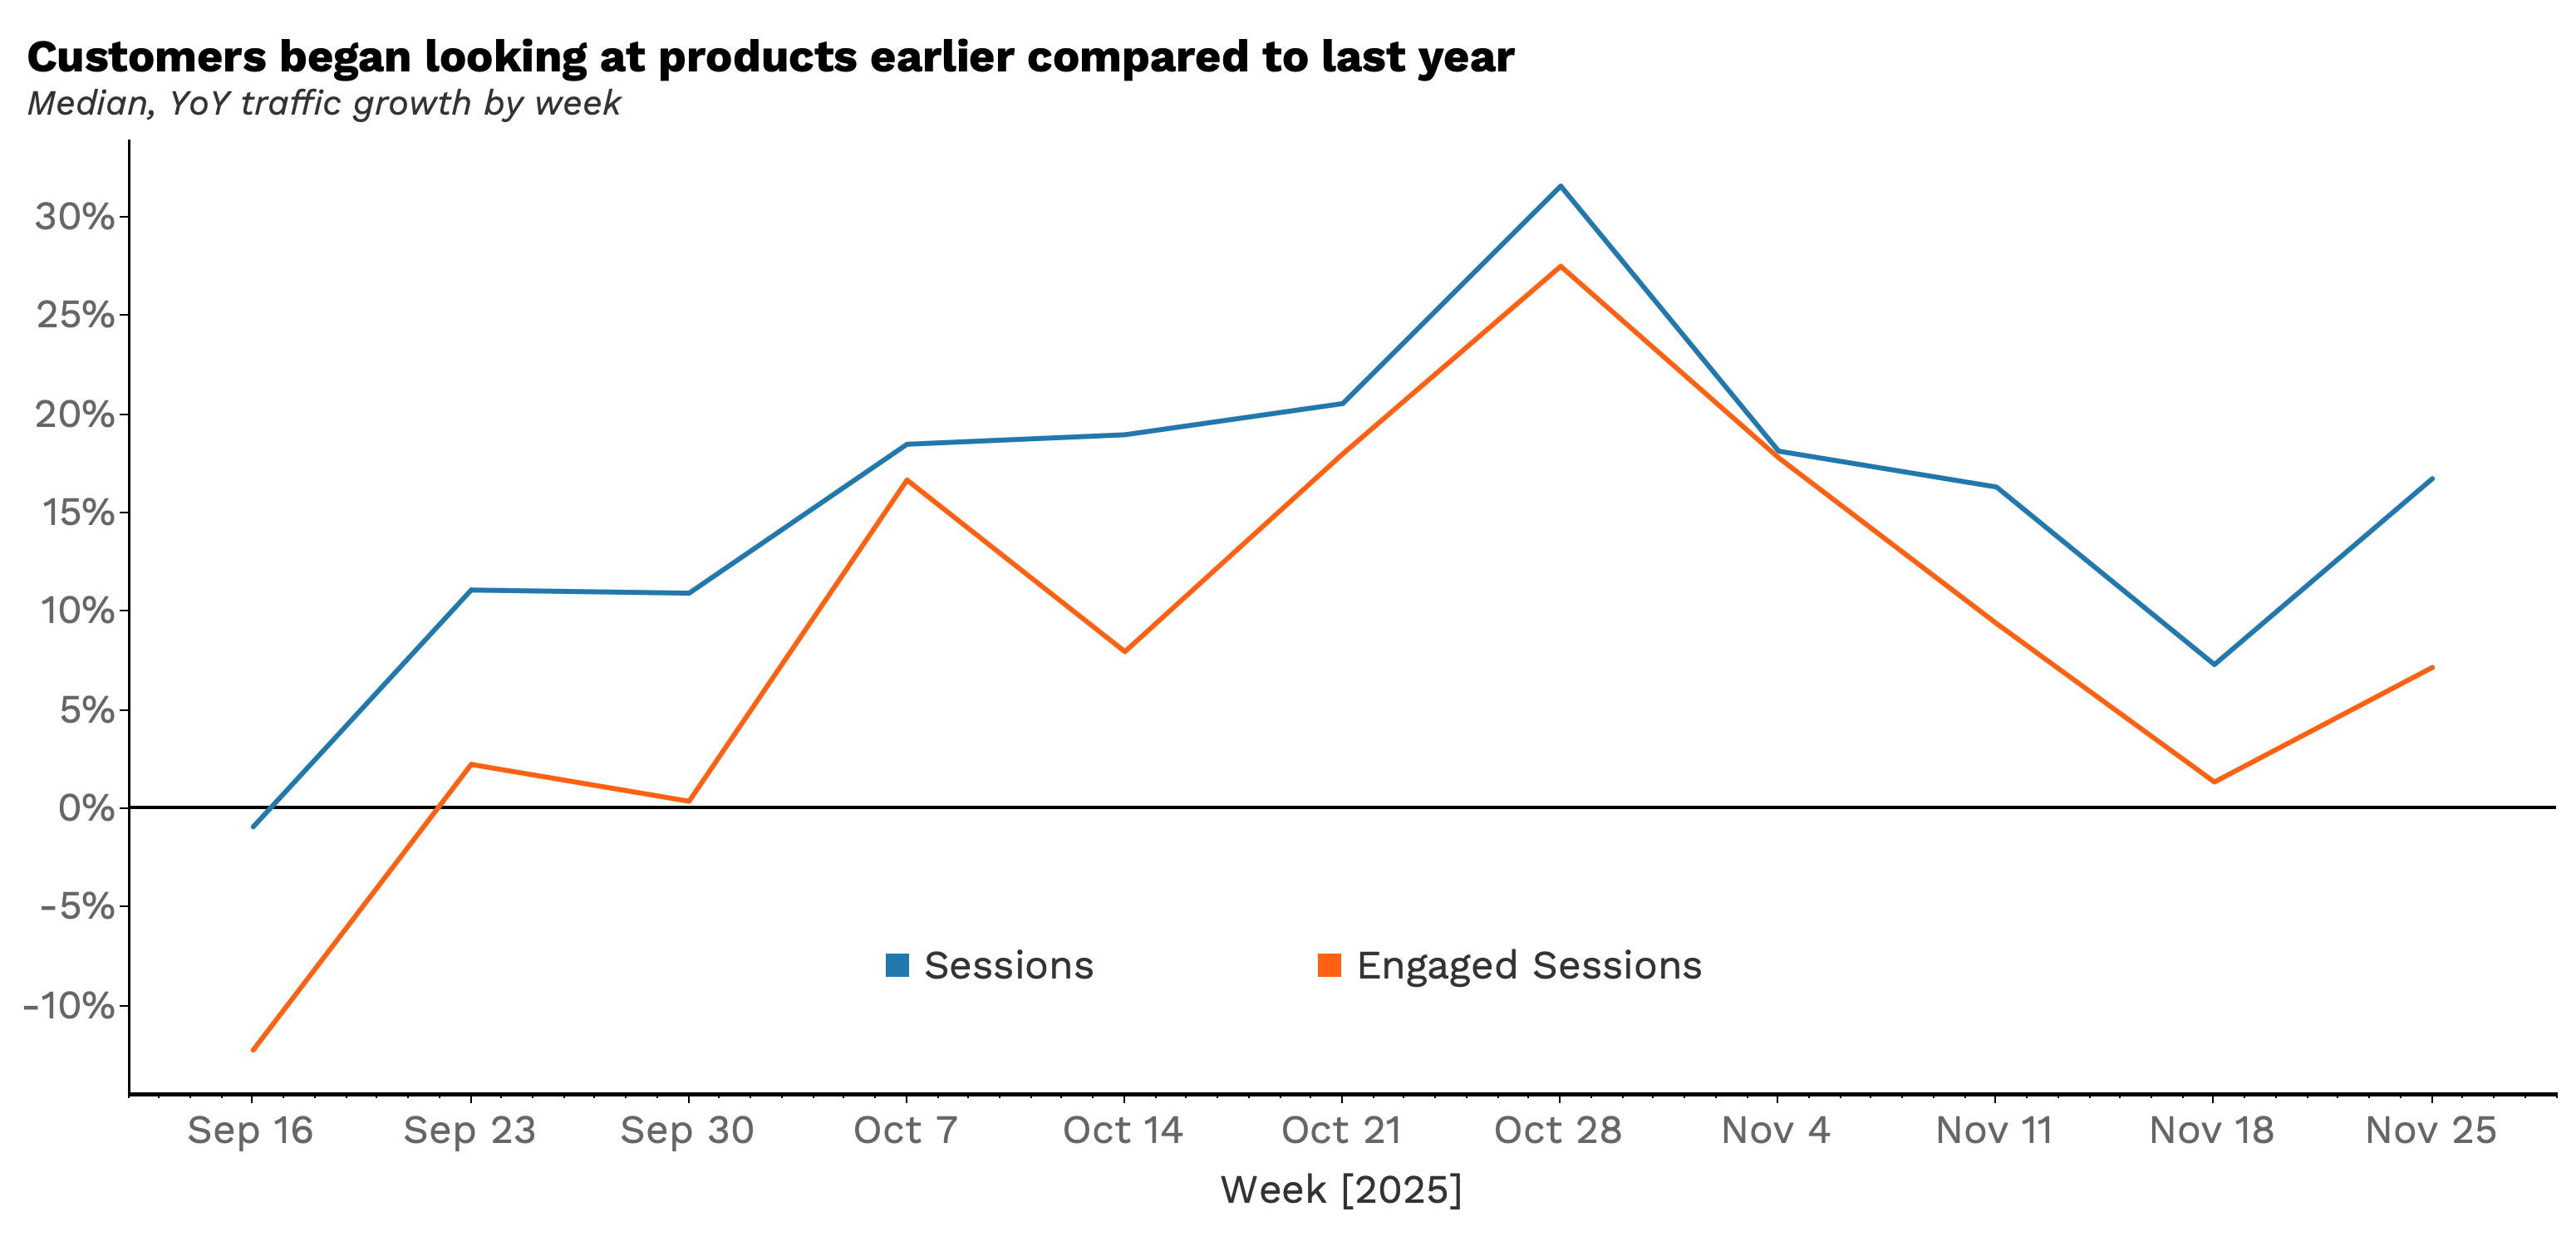
An earlier and longer consideration window shaped Cyber Week performance.
Customers started their shopping journeys earlier in 2025, with traffic growing more in the weeks leading up to Cyber Week than during Cyber Week itself. During the 10 weeks prior to Cyber Week, brands averaged 17% year-over-year session growth, indicating higher volumes of early browsing compared to 2024, continuing the rising early shipping trend observed last year (read the 2024 Cyber Week Report).
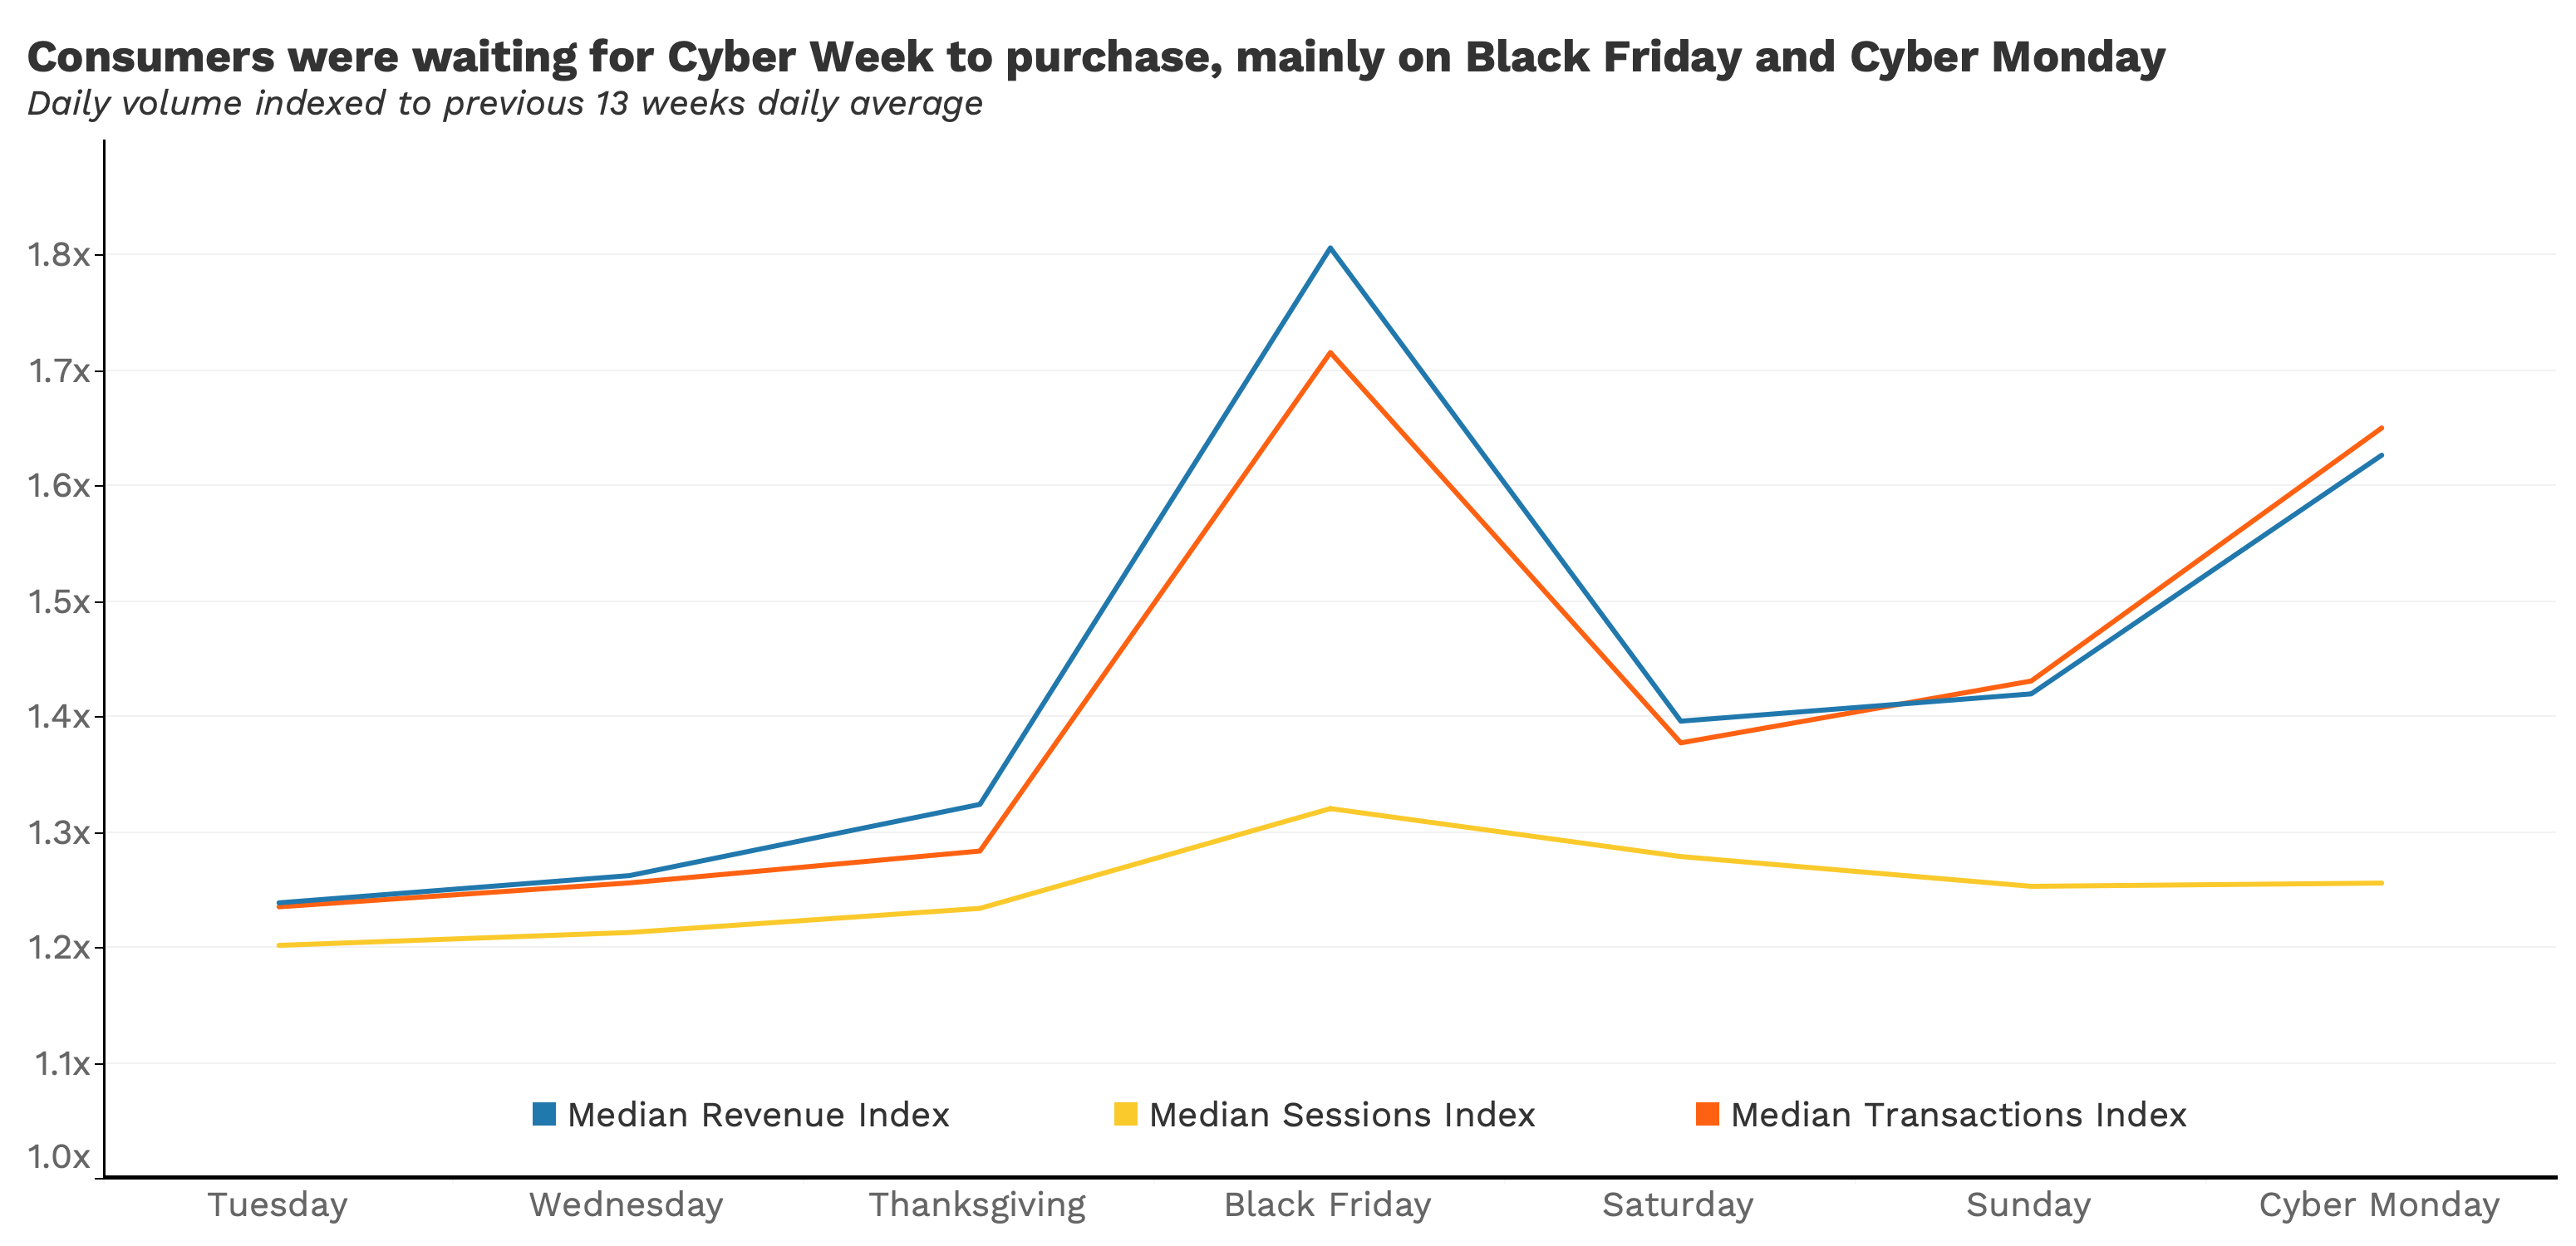
Still, shoppers concentrated purchases around the core promotional days. Black Friday and Cyber Monday produced 1.8x and 1.6x more transactions than the average daily transaction volume during the lead-in period, respectively. This implies early research followed by delayed purchasing, even though 51% of brands offered promotions before Cyber Week. Consumers appeared intent on waiting until they understood the full promotional landscape.
In addition, transaction timing across the long weekend was more evenly distributed than last year, with the transaction index for Black Friday only 4% higher than Cyber Monday (versus a 6% gap in 2024).
Taken together, the data points to a longer consideration phase followed by a strong (but increasingly spread-out) conversion period across the peak weekend rather than a single-day rush.
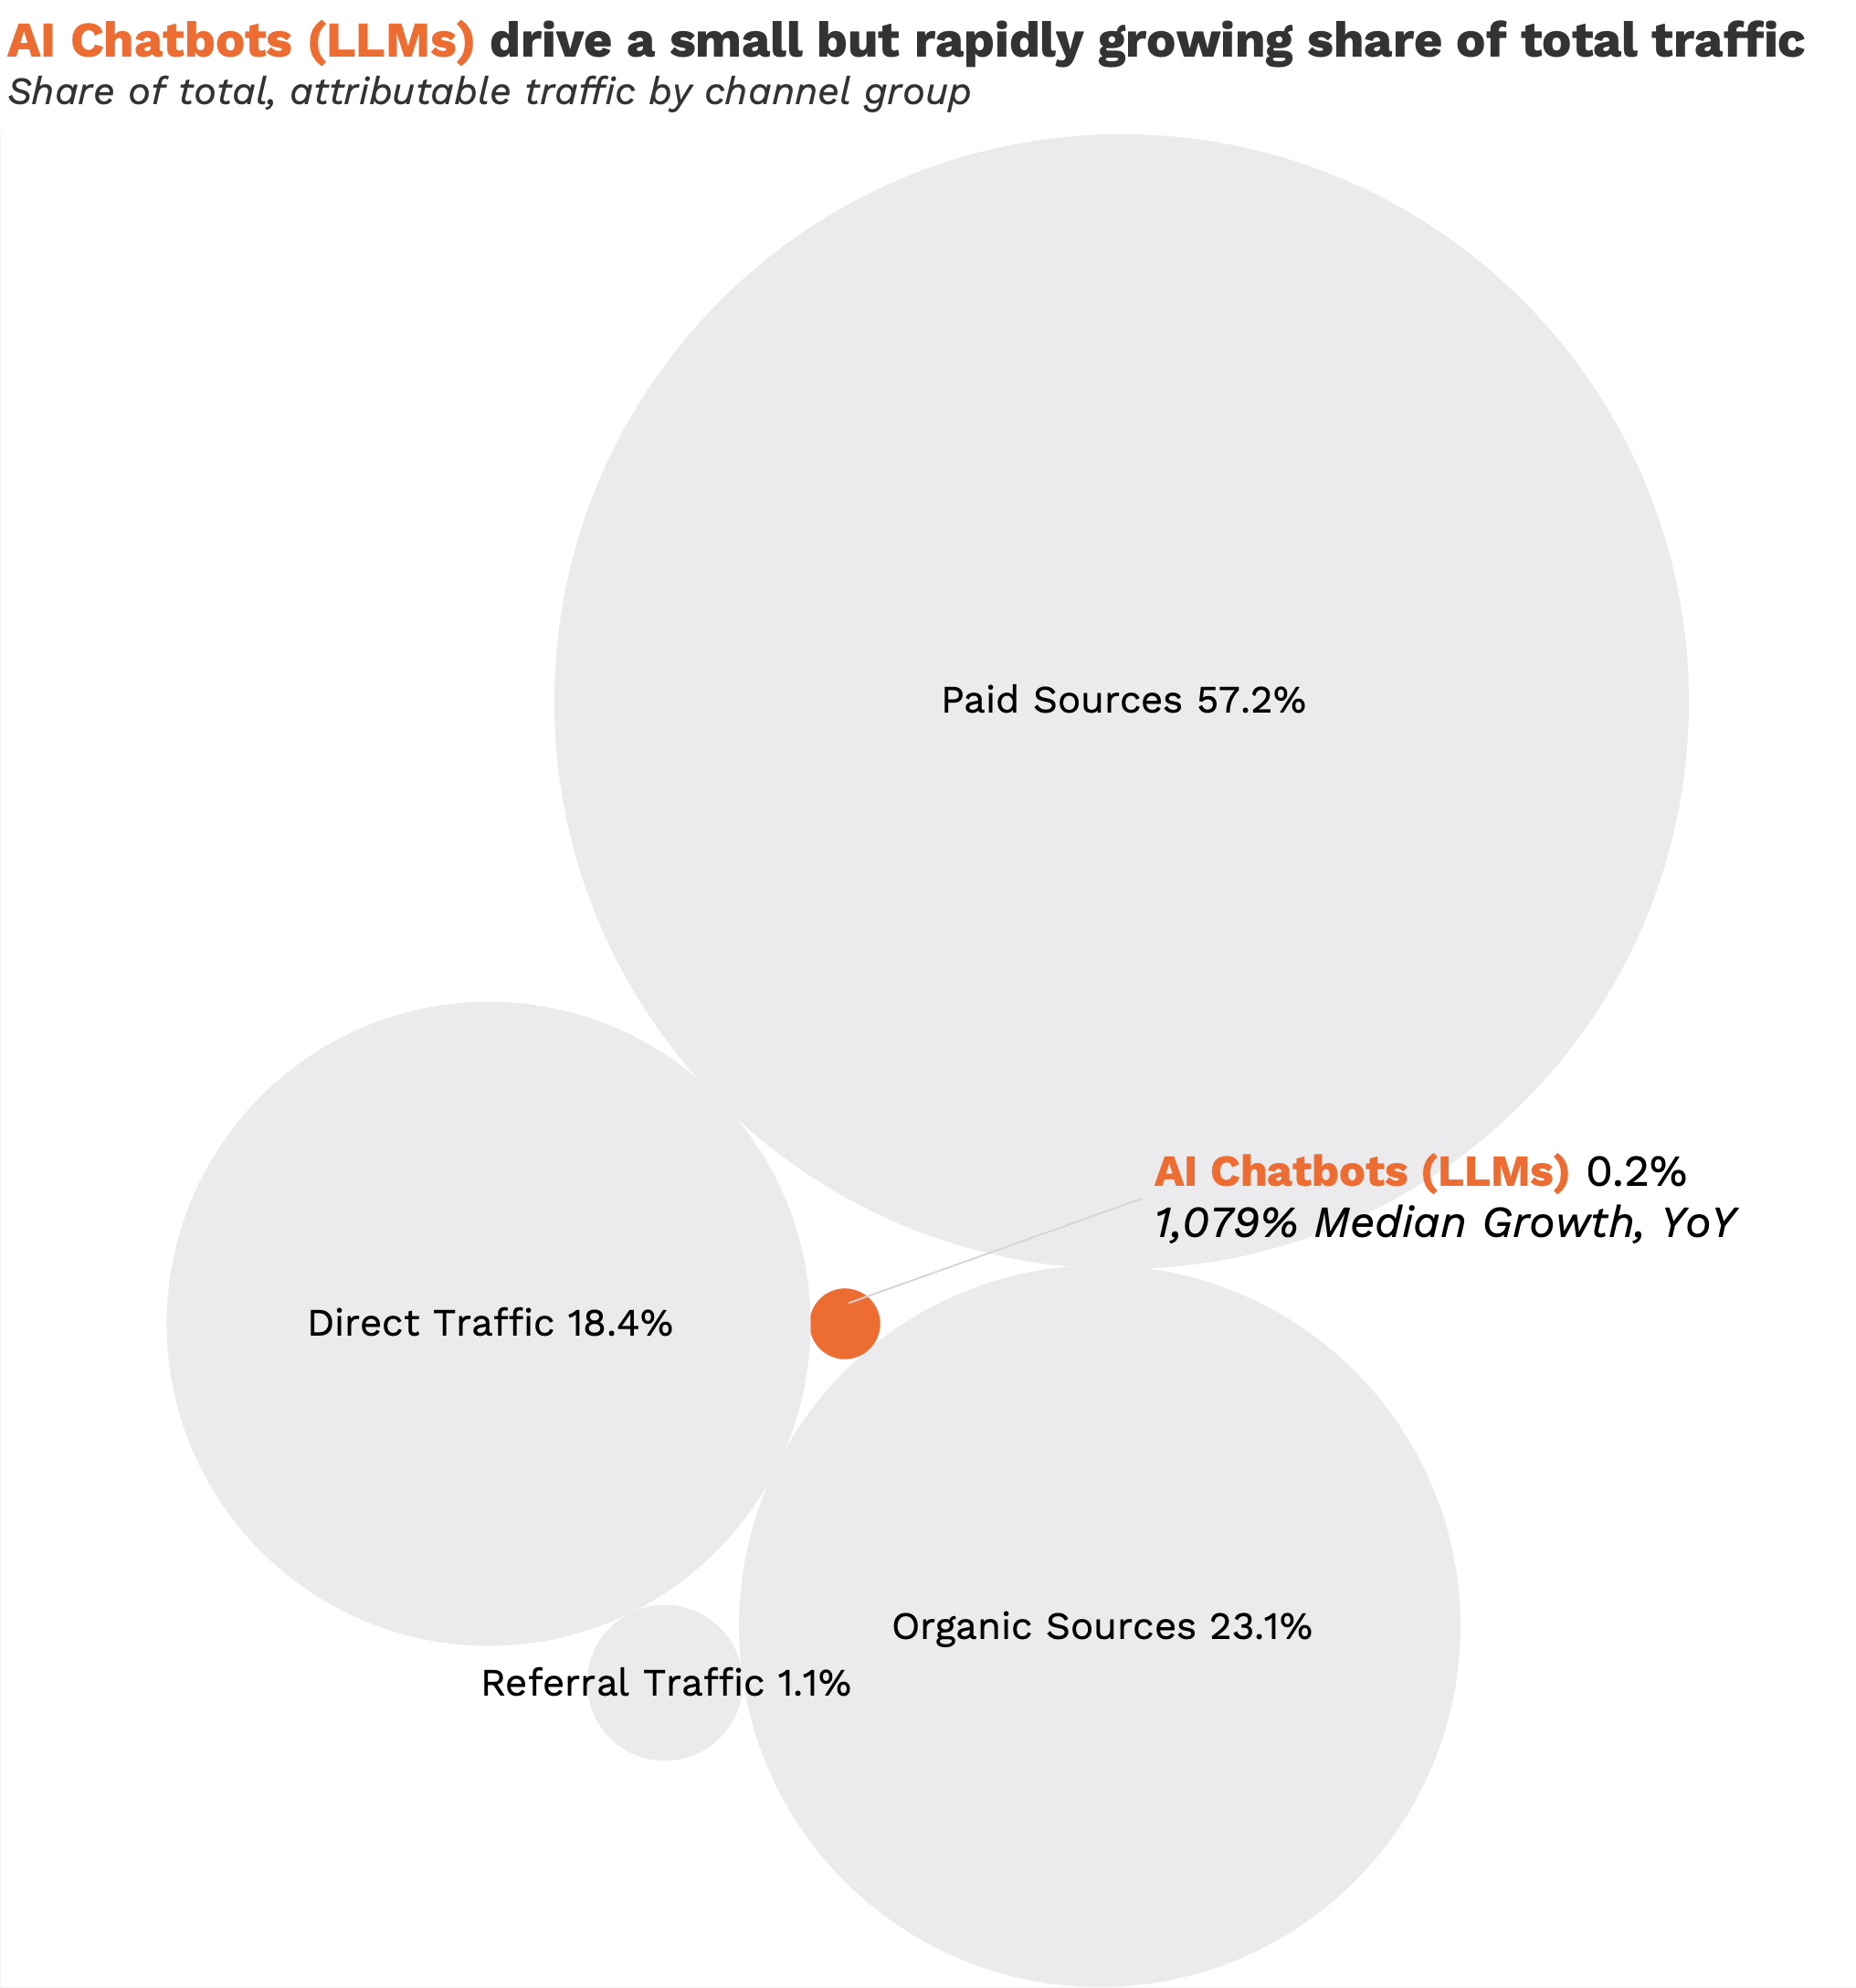
Shoppers turned to AI chatbots (LLMs), like ChatGPT and Gemini, but scale remains small overall.
Traffic driven directly by AI chatbots rose sharply during Cyber Week 2025, with a median year-over-year growth rate of 1,079%. This source of traffic is growing exponentially but still represented only 0.22% of total web sessions. Still, AI chatbots may have some “zero-click” impacts on brands and websites, extending beyond trackable web sessions that begin from direct referrals.
While small, these audiences appear valuable. LLM-referred users converted at a higher rate than 2024 (median conversion rate +61.7%) and posted the highest average order value of any channel group ($292). LLM chatbots are emerging as a high-value but still early-stage source of traffic that may deliver strong basket sizes even as order volume remains low.
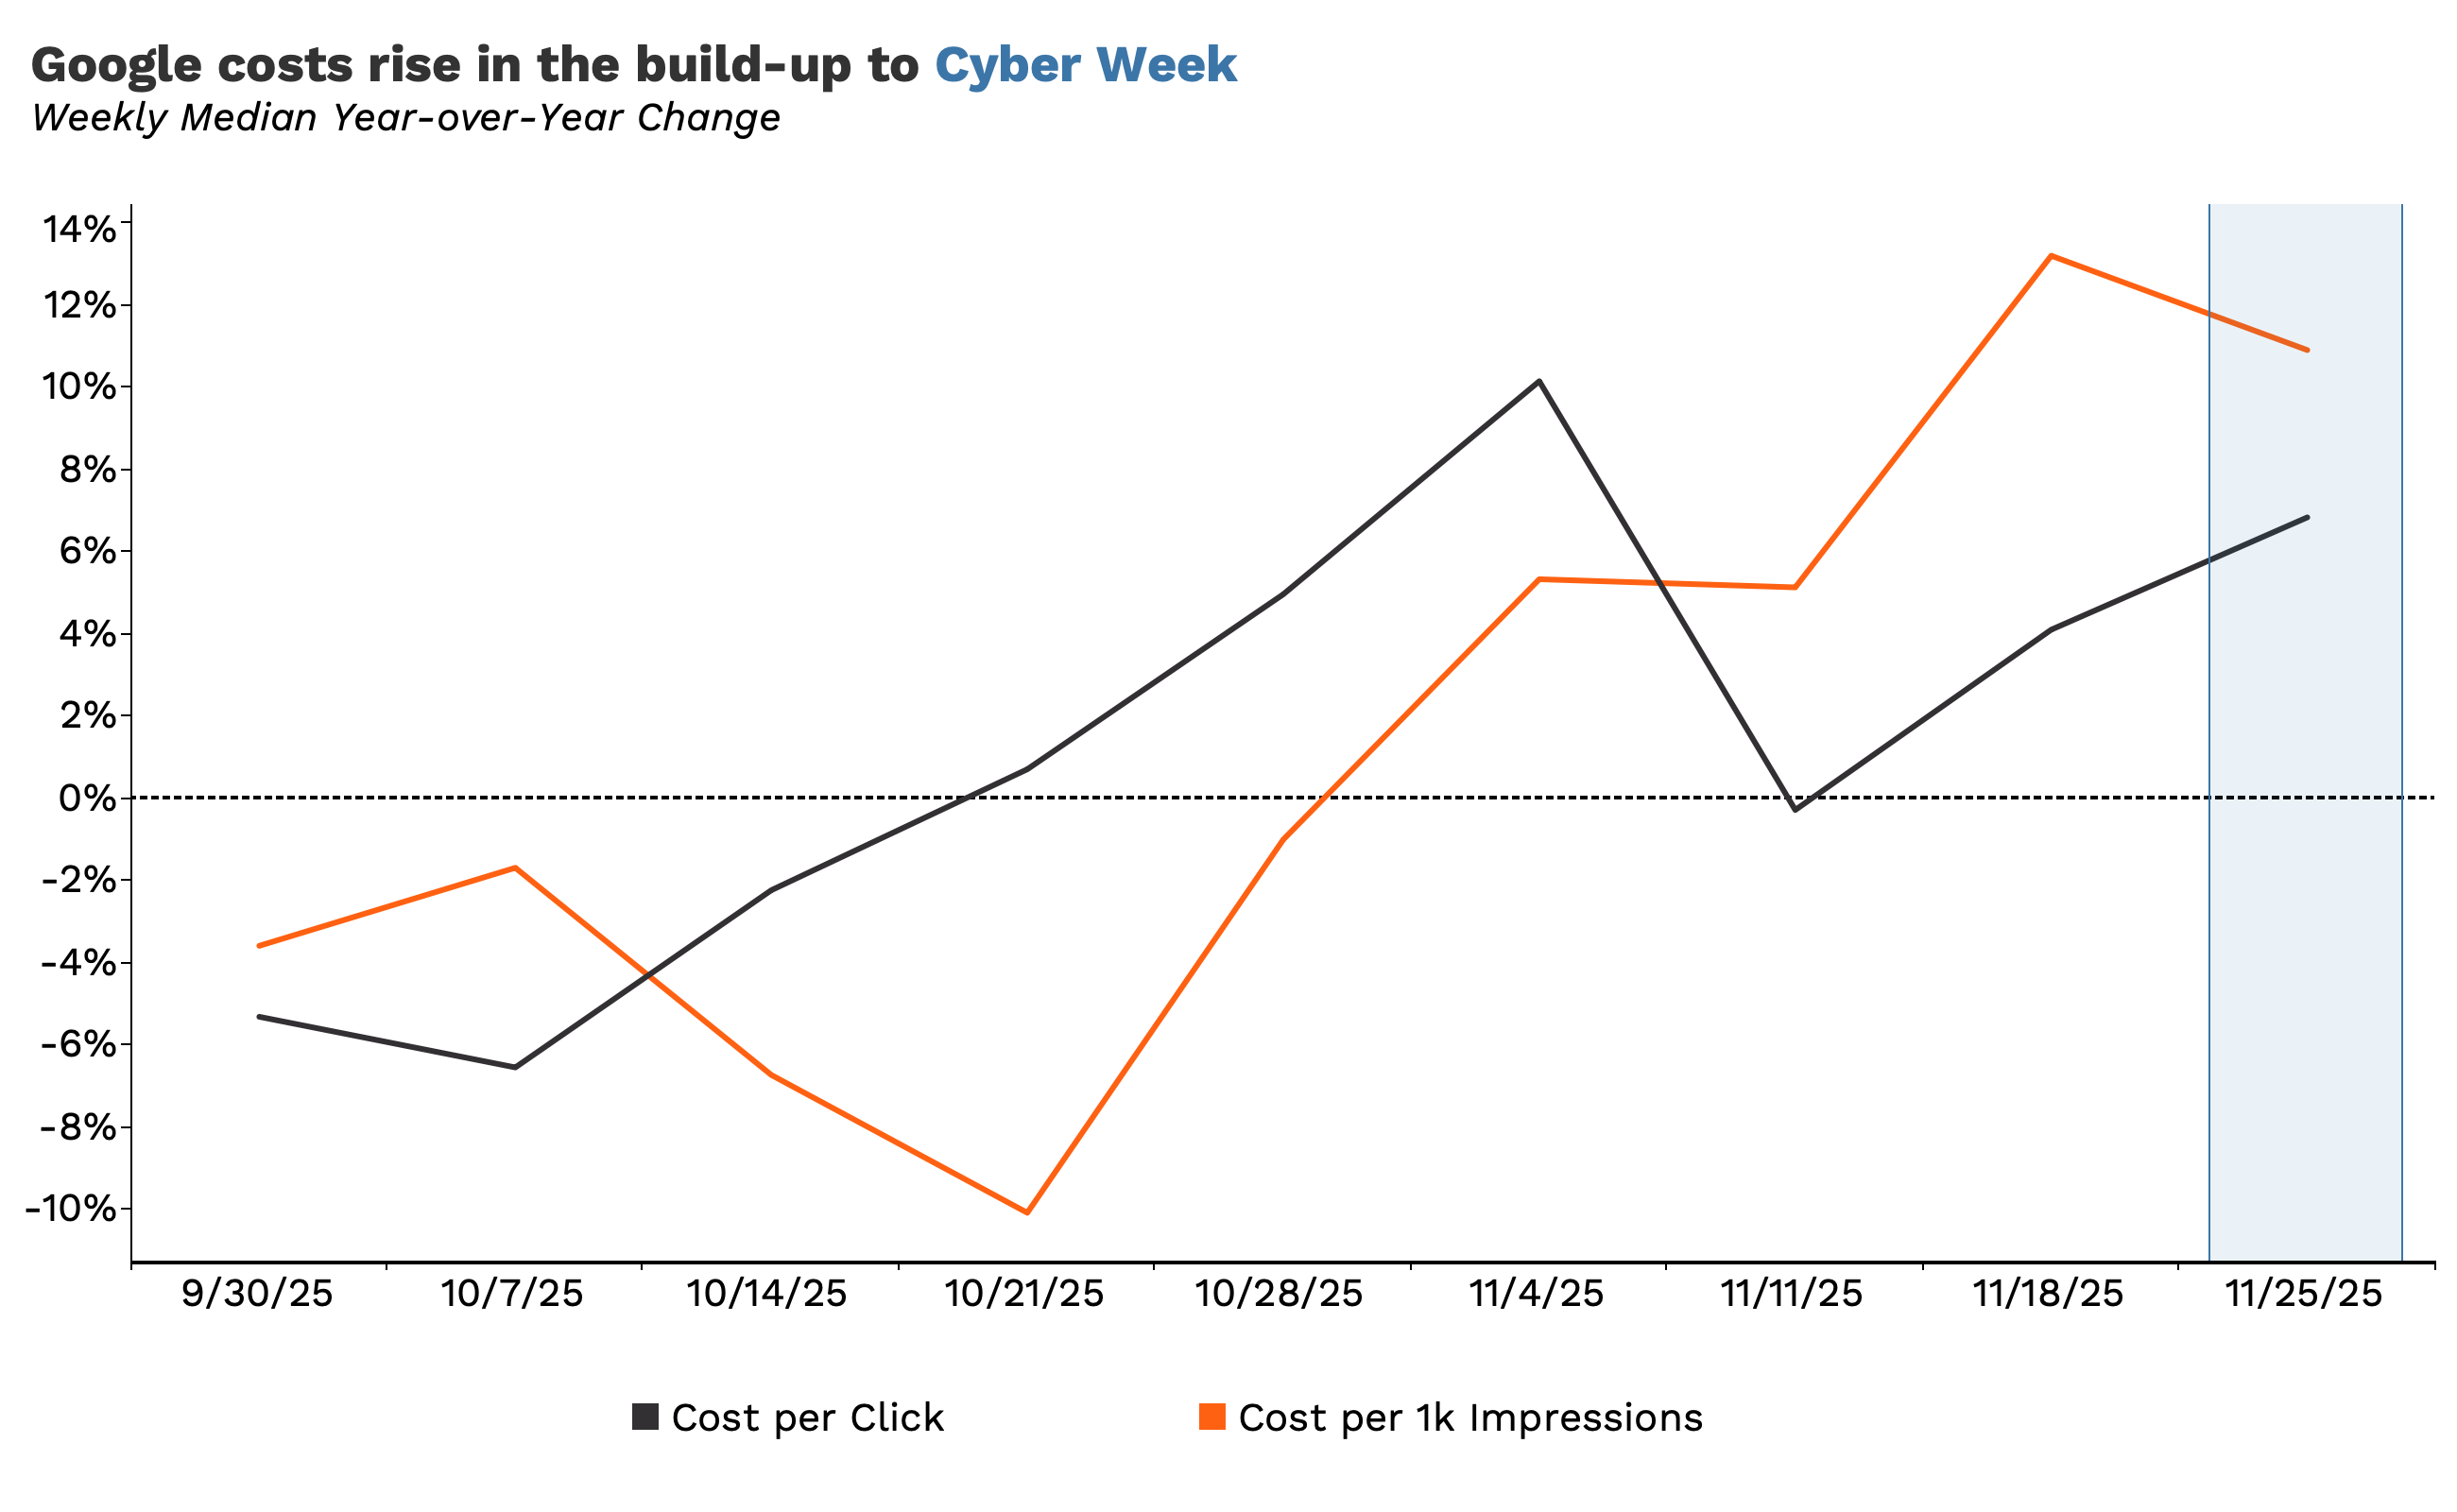
Google Ads costs increased from Cyber Week 2024 while Meta costs decreased.
Two of the largest media channels in our sample, Google and Meta, diverged sharply on cost trends during Cyber Week 2025.
On Google, median Cyber Week CPM increased 10% YoY, after sitting at or below 2024 levels in mid-October and then rising steadily as the season progressed. In the week immediately before Cyber Week, Google costs were already up 13% versus last year, and that pressure peaked on Black Friday with the largest median YoY jump of any day (+18% CPM and +9% CPC).
Advertisers appeared to flood the market for Google Ads, and one of the largest participants may have been Amazon who restarted Google search advertising during Cyber Week after pausing efforts earlier in the year.
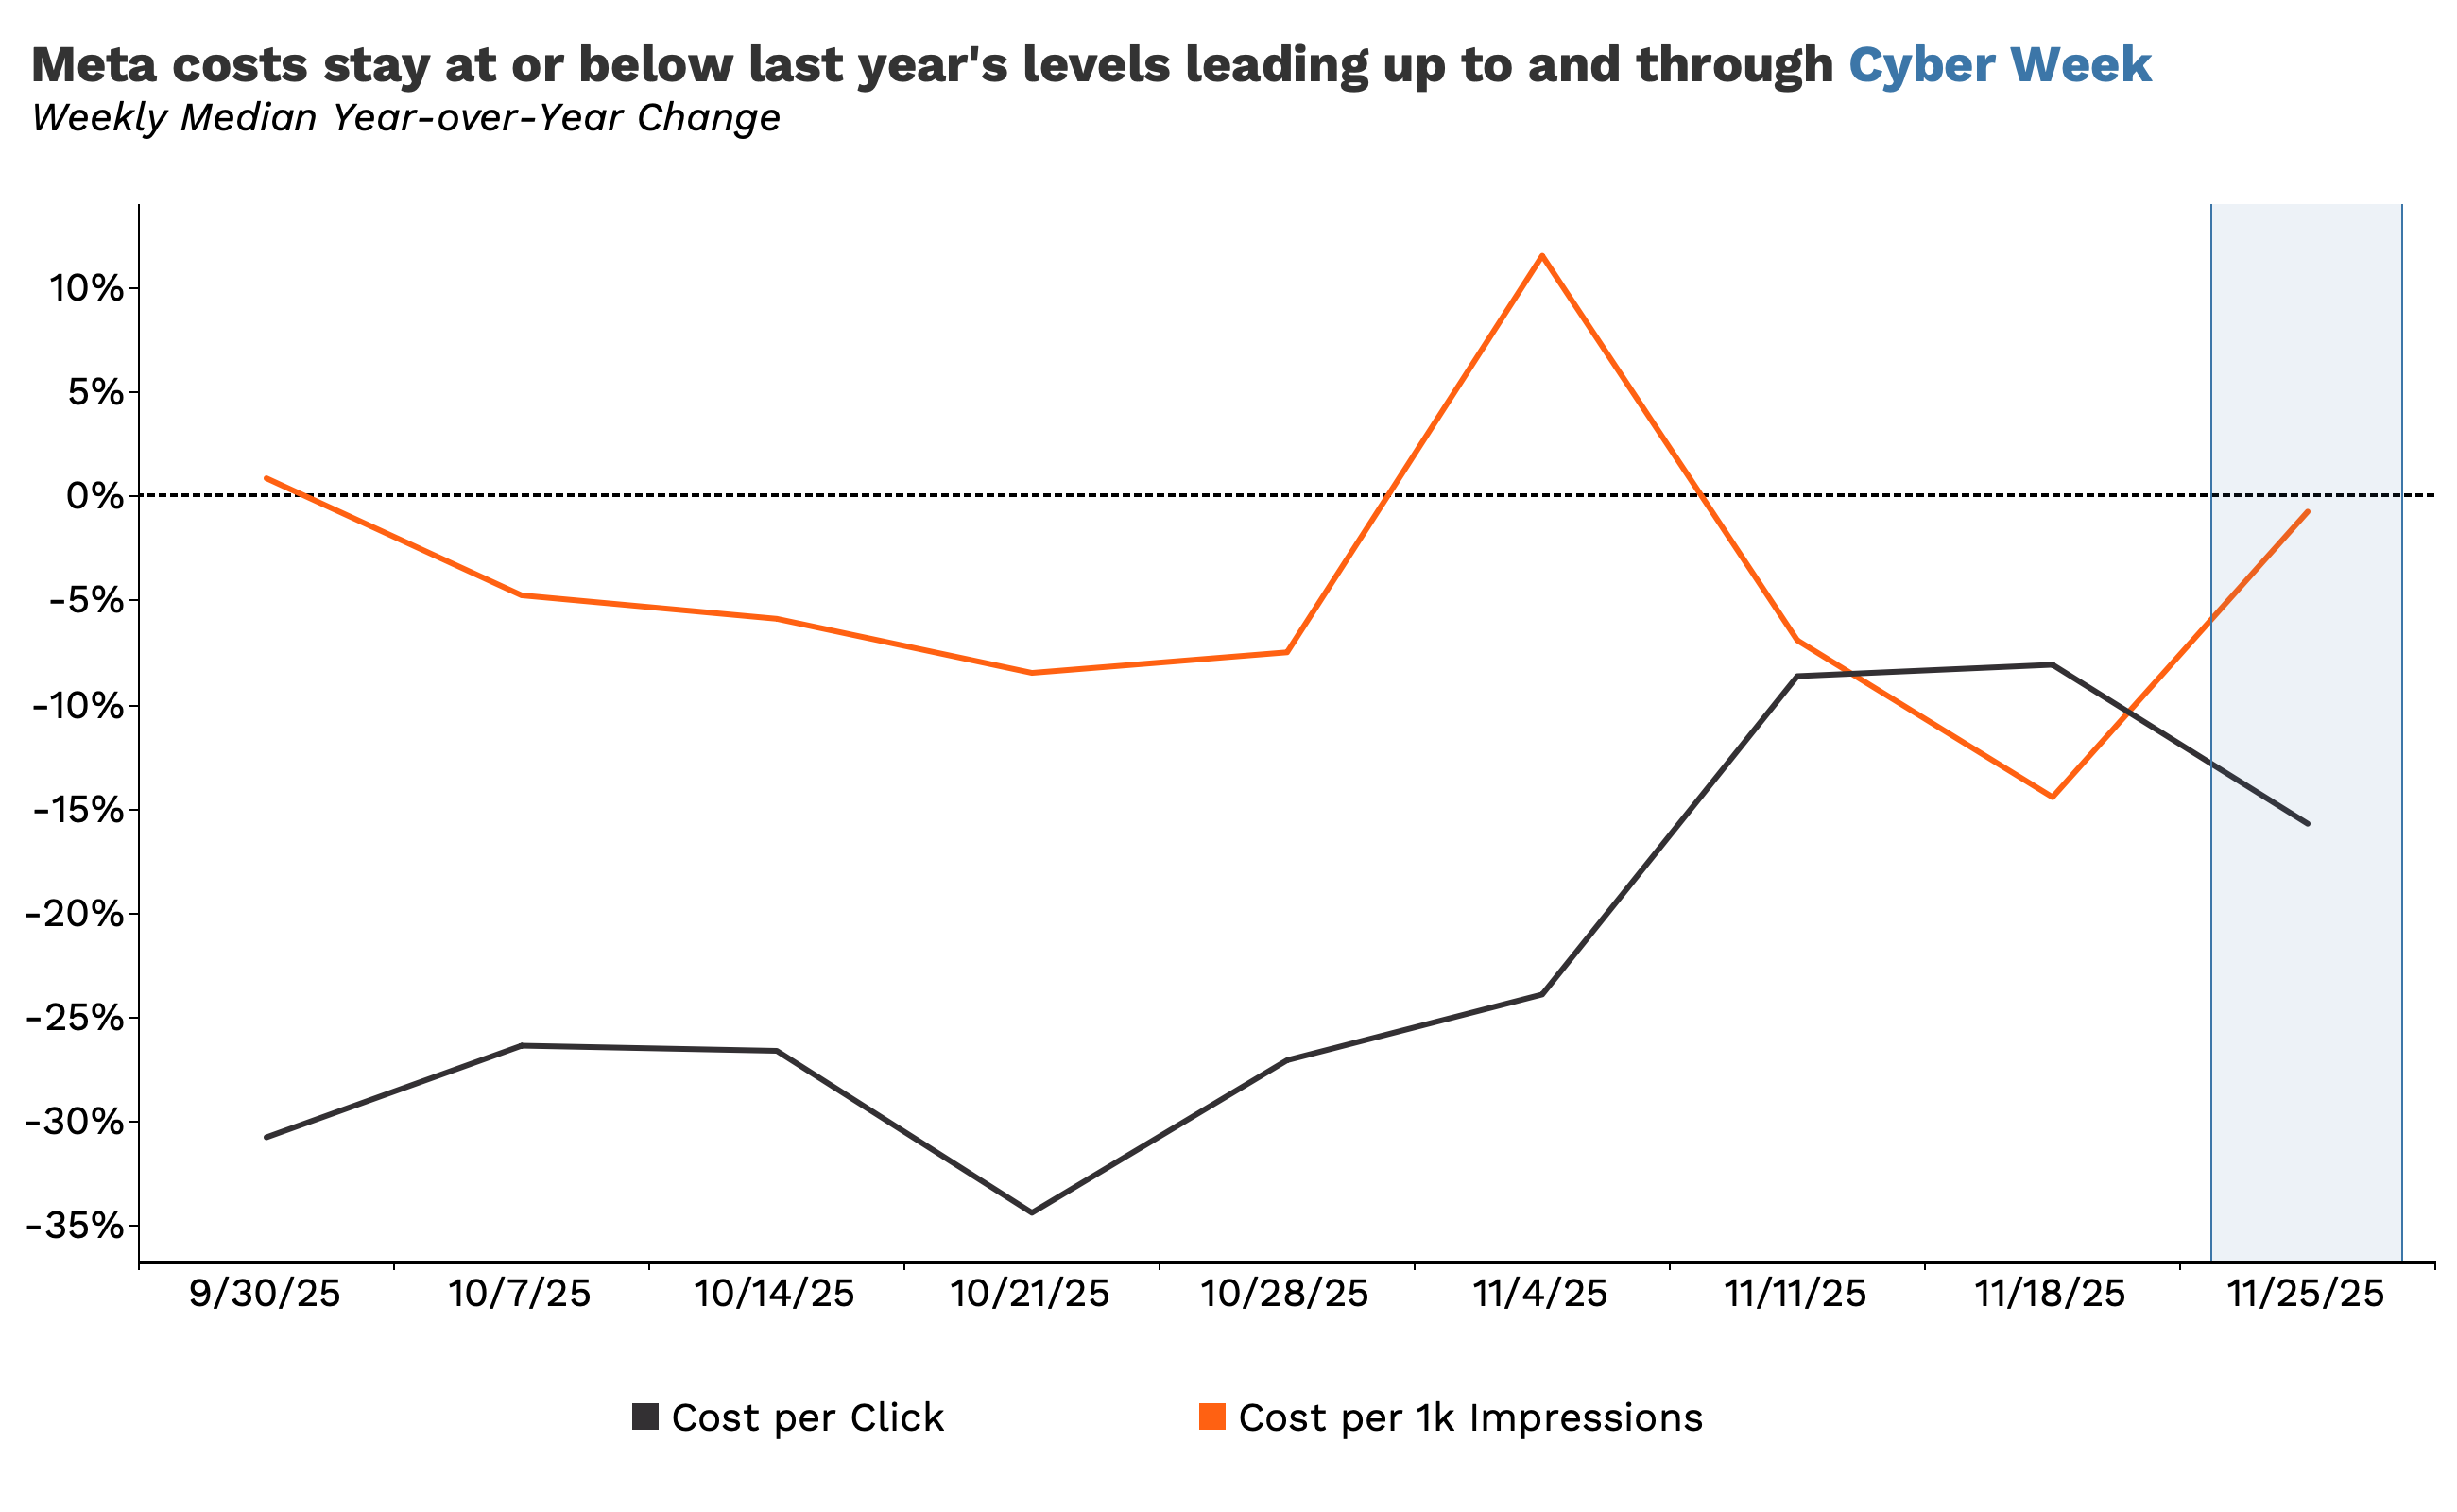
Meta, meanwhile, did not mirror Google’s inflation. Median CPC remained below 2024 levels throughout the lead-in period and ended Cyber Week down 16% YoY. However, Meta impression costs rose later in the weekend, with median CPM moving above 2024 levels beginning Saturday and staying elevated through Cyber Monday.
Although cost growth was stable, more advertisers flocked to Meta in 2025 than 2024. More advertisers may have resulted in scarcer inventory and increased CPMs during key moments as Cyber Week drew to a close. While Meta continues to be an integral part of the performance media mix, it's becoming increasingly more important for brands to diversify their media mix during high-competition times of the year.
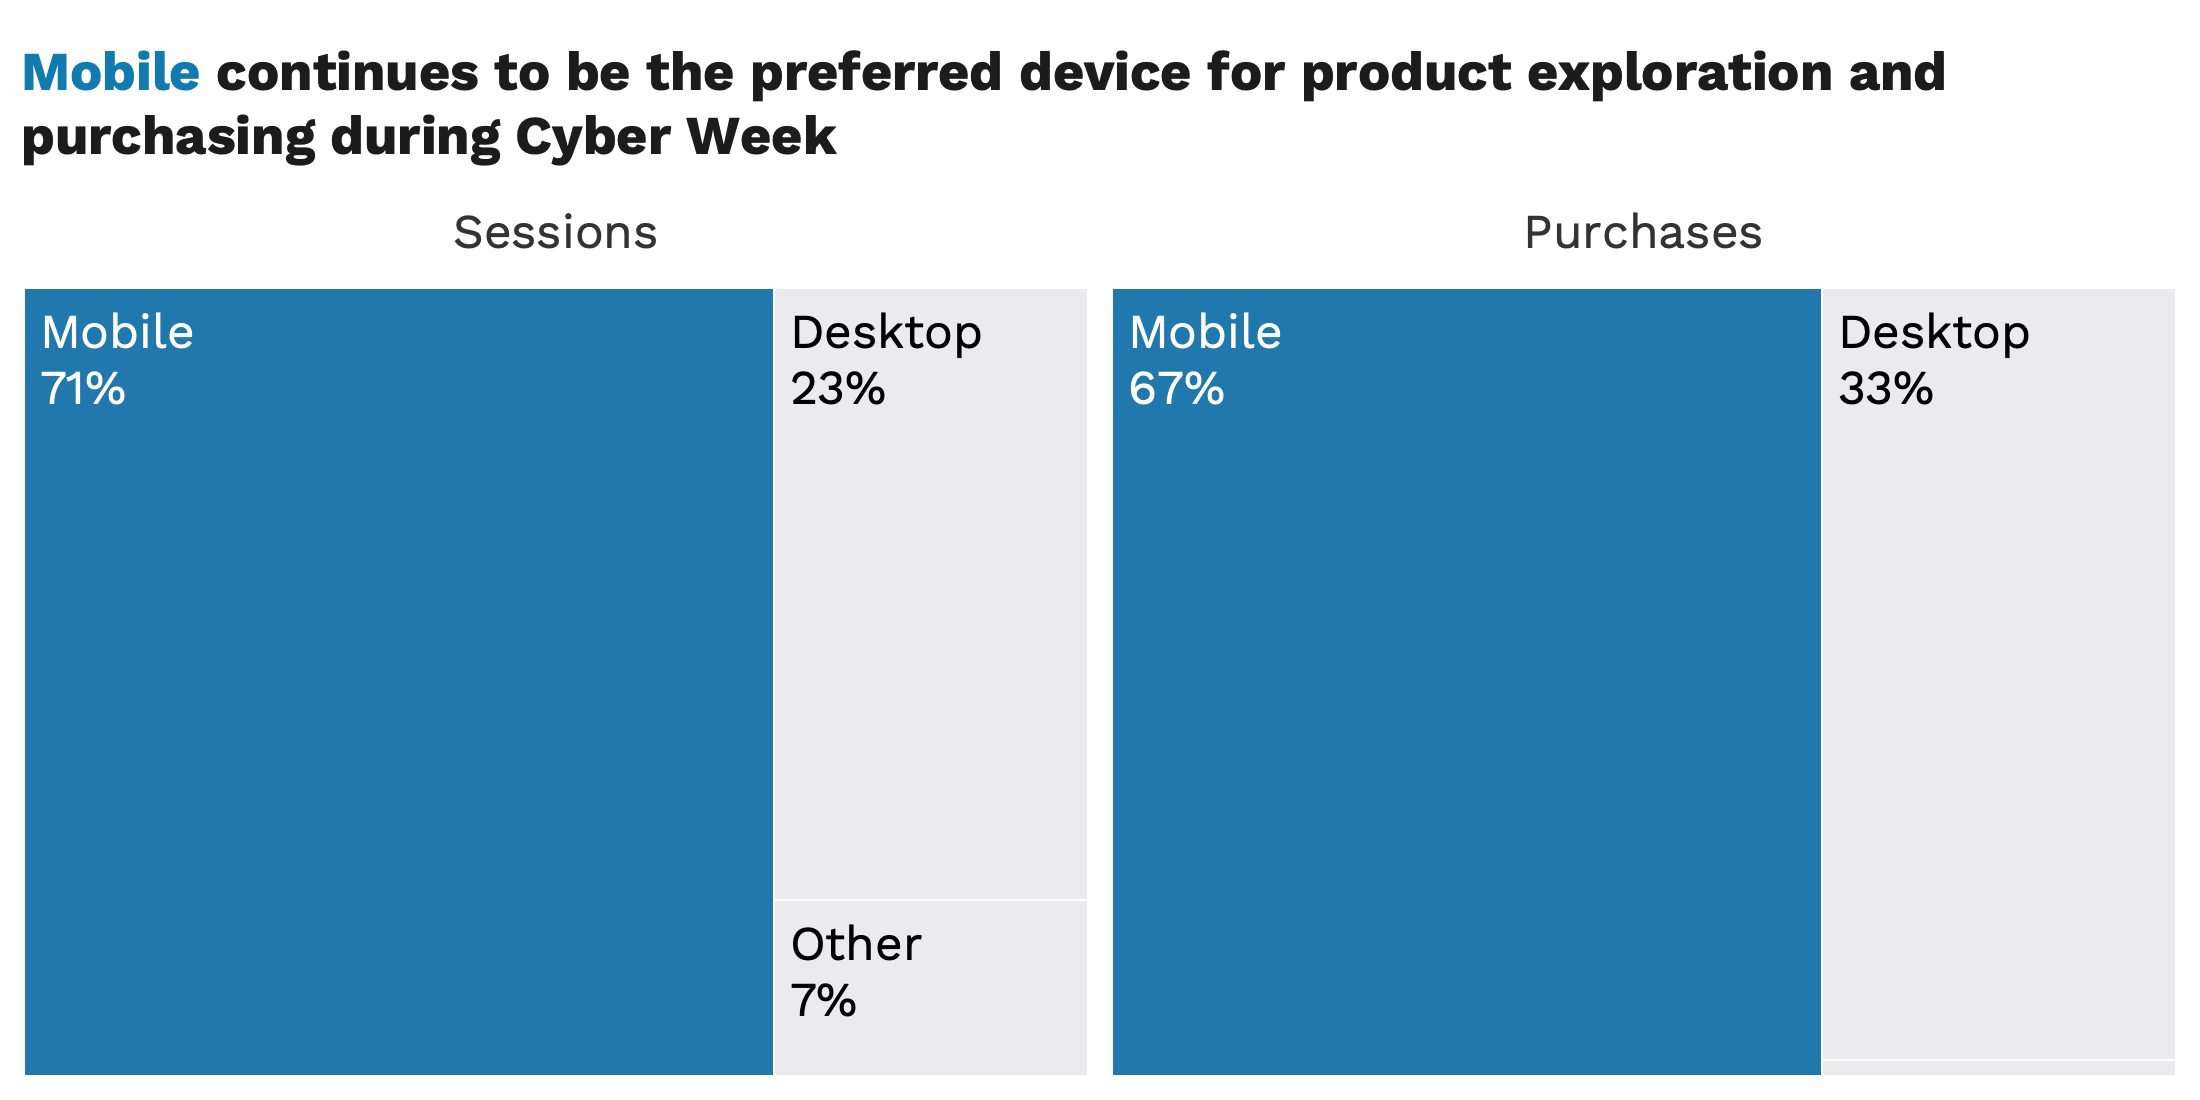
People did most of their shopping on their phones.
Mobile continues to be the preferred device for consumer engagement and purchasing during Cyber Week. Nearly 70% of sessions and pageviews occurred on mobile devices, and about 67% of purchases were completed on mobile as well, indicating that mobile is not just a browsing channel, but also a primary conversion environment.
Despite more purchases happening on mobile, it appears consumers are going to desktop to buy bigger ticket items, as the median average order value (AOV) on desktop devices was 33% higher than mobile devices.
Looking Forward
Cyber Week is only one moment in the broader shopper landscape, but the shifts we saw this year offer important clues for where consumer expectations are heading. As brands refine their 2026 plans, the opportunity lies in connecting these signals back to long-term brand building, sustained community engagement, and performance strategies that flex with real behavior. If you’re curious about how these insights should inform your brand’s 2026 strategy, reach out to us at info@backbone.media.
ABOUT BACKBONE’S DATA
The insights herein were compiled using GA4 data from Backbone’s sample of (anonymized) brands and was analyzed by Backbone’s Data & Analytics team.
